
Standard deviation formula सांख्यिकी (Statistics) में एक महत्वपूर्ण उपकरण है जो डेटा में विविधता (variation) को मापने के लिए उपयोग किया जाता है। चाहे आप छात्र हों, डेटा एनालिस्ट हों या शोधकर्ता, इस फॉर्मूले को समझना सही डेटा विश्लेषण के लिए जरूरी है। इस लेख में हम स्टैण्डर्ड डिविएशन फॉर्मूला, इसके महत्व और गणना की प्रक्रिया को विस्तार से समझेंगे।
What is Standard Deviation?
Standard deviation एक सांख्यिकीय माप है जो बताता है कि डेटा के मान औसत (mean) से कितने दूर या पास हैं। यदि स्टैण्डर्ड डिविएशन कम है तो डेटा औसत के करीब होते हैं और यदि ज्यादा है तो डेटा में अधिक विविधता होती है।
Why Standard Deviation Matters
स्टैण्डर्ड डिविएशन विभिन्न क्षेत्रों में उपयोगी है:
- Finance (वित्त): स्टॉक मार्केट की उतार-चढ़ाव को मापने के लिए।
- Education (शिक्षा): छात्रों के टेस्ट स्कोर की स्थिरता को जानने के लिए।
- Quality Control (गुणवत्ता नियंत्रण): उत्पादन प्रक्रिया में बदलावों को मॉनिटर करने के लिए।
- Research (अनुसंधान): प्रयोगात्मक डेटा की विश्वसनीयता को समझने के लिए।
स्टैण्डर्ड डिविएशन फॉर्मूला समझकर आप डेटा के आधार पर सही निर्णय ले सकते हैं।
The Standard Deviation Formula
स्टैण्डर्ड डिविएशन फॉर्मूला मुख्य रूप से दो प्रकार के होते हैं: Population Standard Deviation और Sample Standard Deviation। यह इस बात पर निर्भर करता है कि आप पूरे जनसंख्या का डेटा देख रहे हैं या उसका केवल एक नमूना (sample)।
Population Standard Deviation Formula
जनसंख्या के लिए फॉर्मूला: σ=∑i=1N(xi−μ)2N\sigma = \sqrt{\frac{\sum_{i=1}^{N}(x_i – \mu)^2}{N}}σ=N∑i=1N(xi−μ)2
जहाँ:
- σ\sigmaσ = Population standard deviation
- NNN = कुल डेटा पॉइंट्स की संख्या
- xix_ixi = प्रत्येक डेटा पॉइंट
- μ\muμ = Population mean
- ∑\sum∑ = जोड़ का चिन्ह
Sample Standard Deviation Formula
नमूने के लिए फॉर्मूला: s=∑i=1n(xi−xˉ)2n−1s = \sqrt{\frac{\sum_{i=1}^{n}(x_i – \bar{x})^2}{n-1}}s=n−1∑i=1n(xi−xˉ)2
जहाँ:
- sss = Sample standard deviation
- nnn = Sample में डेटा पॉइंट्स की संख्या
- xix_ixi = प्रत्येक डेटा पॉइंट
- xˉ\bar{x}xˉ = Sample mean
Sample फॉर्मूला में n−1n-1n−1 का उपयोग Bessel’s correction के कारण किया जाता है, ताकि अनुमान सही हो।
Step-by-Step Guide to Calculating Standard Deviation
स्टैण्डर्ड डिविएशन की गणना को समझना आसान है यदि आप इसे चरणबद्ध तरीके से करें।
Step 1: Find the Mean
सबसे पहले डेटा का औसत निकालें: Mean=सभी डेटा पॉइंट्स का योगडेटा पॉइंट्स की संख्या\text{Mean} = \frac{\text{सभी डेटा पॉइंट्स का योग}}{\text{डेटा पॉइंट्स की संख्या}}Mean=डेटा पॉइंट्स की संख्यासभी डेटा पॉइंट्स का योग
Step 2: Subtract the Mean from Each Data Point
हर डेटा पॉइंट से औसत घटाएँ: xi−xˉयाxi−μx_i – \bar{x} \quad \text{या} \quad x_i – \muxi−xˉयाxi−μ
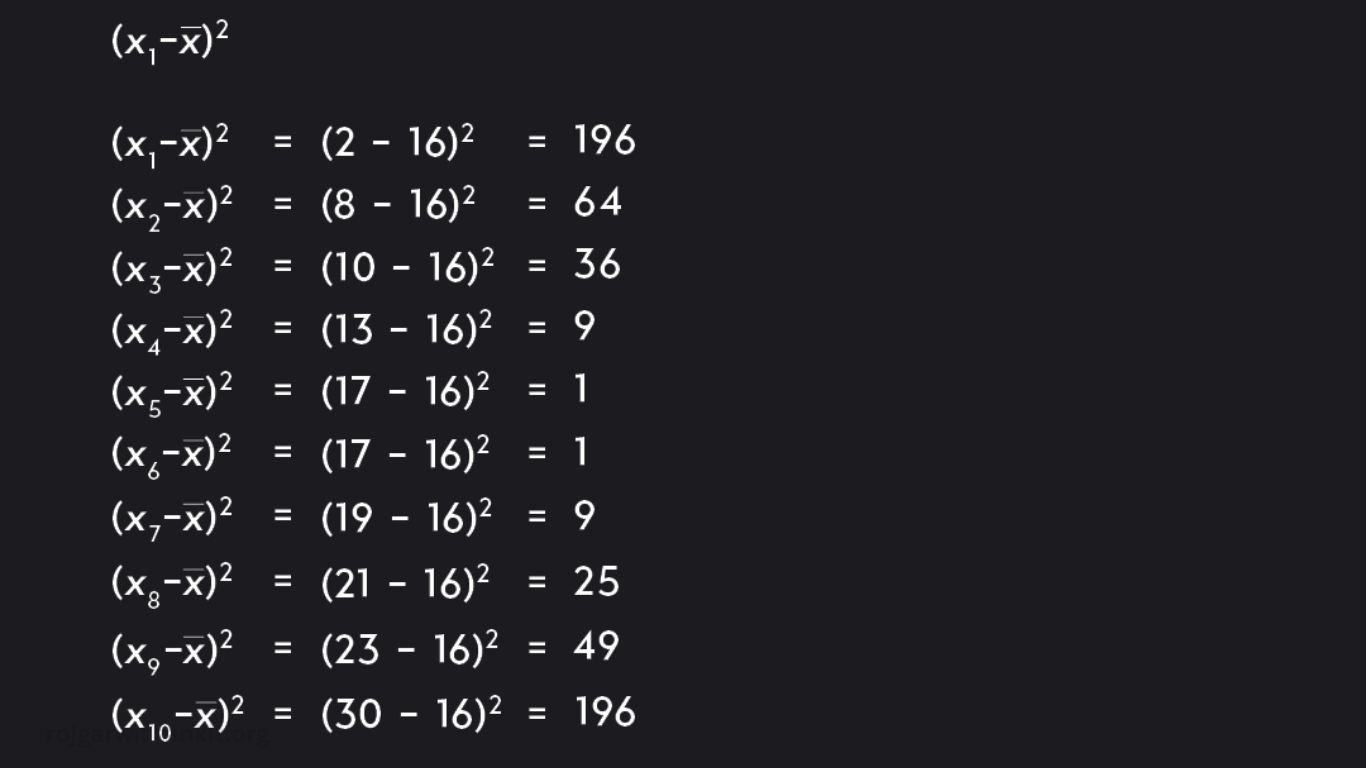
Step 3: Square Each Deviation
हर अंतर को वर्ग (square) में बदलें ताकि नकारात्मक मान समाप्त हो जाएं: (xi−xˉ)2(x_i – \bar{x})^2(xi−xˉ)2
Step 4: Sum the Squared Deviations
सभी वर्ग अंतर का योग करें: ∑i=1n(xi−xˉ)2\sum_{i=1}^{n} (x_i – \bar{x})^2i=1∑n(xi−xˉ)2
Step 5: Divide by the Number of Data Points (or n-1 for Sample)
Population के लिए: Variance=∑(xi−μ)2N\text{Variance} = \frac{\sum (x_i – \mu)^2}{N}Variance=N∑(xi−μ)2
Sample के लिए: Variance=∑(xi−xˉ)2n−1\text{Variance} = \frac{\sum (x_i – \bar{x})^2}{n-1}Variance=n−1∑(xi−xˉ)2
Step 6: Take the Square Root
अंत में Variance का वर्गमूल निकालें: σ या s=Variance\sigma \text{ या } s = \sqrt{\text{Variance}}σ या s=Variance
Example Calculation
मान लीजिए हमारे पास Sample Data है: 5, 7, 3, 9, 10
Step 1: Find the Mean xˉ=5+7+3+9+105=6.8\bar{x} = \frac{5+7+3+9+10}{5} = 6.8xˉ=55+7+3+9+10=6.8
Step 2: Subtract the Mean 5−6.8=−1.8,7−6.8=0.2,3−6.8=−3.8,9−6.8=2.2,10−6.8=3.25-6.8=-1.8, \quad 7-6.8=0.2, \quad 3-6.8=-3.8, \quad 9-6.8=2.2, \quad 10-6.8=3.25−6.8=−1.8,7−6.8=0.2,3−6.8=−3.8,9−6.8=2.2,10−6.8=3.2
Step 3: Square Each Deviation (−1.8)2=3.24,0.22=0.04,(−3.8)2=14.44,2.22=4.84,3.22=10.24(-1.8)^2=3.24, \quad 0.2^2=0.04, \quad (-3.8)^2=14.44, \quad 2.2^2=4.84, \quad 3.2^2=10.24(−1.8)2=3.24,0.22=0.04,(−3.8)2=14.44,2.22=4.84,3.22=10.24
Step 4: Sum the Squares 3.24+0.04+14.44+4.84+10.24=32.83.24 + 0.04 + 14.44 + 4.84 + 10.24 = 32.83.24+0.04+14.44+4.84+10.24=32.8
Step 5: Divide by n-1 Variance=32.84=8.2\text{Variance} = \frac{32.8}{4} = 8.2Variance=432.8=8.2
Step 6: Take the Square Root s=8.2≈2.86s = \sqrt{8.2} \approx 2.86s=8.2≈2.86
इस Sample Data का Standard Deviation लगभग 2.86 है।
Key Tips for Using the Standard Deviation Formula
- हमेशा पहचानें कि डेटा Population है या Sample।
- वर्ग अंतर (Squared deviation) सही तरीके से निकालें।
- यूनिट्स का ध्यान रखें: Standard deviation की यूनिट original data की तरह ही होती है।
- बड़े डेटा सेट के लिए Excel, Python या R जैसे टूल्स का उपयोग करें।
Standard Deviation vs. Variance
- Variance औसत वर्ग अंतर (average squared deviation) मापता है।
- Standard deviation Variance का वर्गमूल होता है और यह डेटा की असली यूनिट में होता है।
- इसलिए Standard deviation अधिक समझने में आसान और व्यावहारिक होता है।
Applications of Standard Deviation
- Finance: निवेश में जोखिम का मूल्यांकन।
- Education: छात्रों के स्कोर की स्थिरता मापना।
- Healthcare: रोगियों के स्वास्थ्य डेटा में बदलाव का निरीक्षण।
- Manufacturing: उत्पादन प्रक्रिया में गुणवत्ता नियंत्रण।
- Research: प्रयोगात्मक परिणामों की तुलना।
Common Mistakes to Avoid
- Population और Sample फॉर्मूला को मिलाना।
- Mean की गणना को छोड़ देना।
- यूनिट्स की अनदेखी करना।
- केवल Standard deviation पर भरोसा करना; Mean और Range के साथ प्रयोग करें।
Frequently Asked Questions
What is the standard deviation formula
The standard deviation formula is a mathematical expression used to measure how much individual data points deviate from the mean It can be calculated for a population using sigma equals the square root of the sum of squared differences between each data point and the mean divided by N or for a sample using s equals the square root of the sum of squared differences divided by n minus one
What is the difference between population and sample standard deviation
Population standard deviation considers all data points in a population and divides the sum of squared deviations by N Sample standard deviation uses a subset of the population and divides by n minus one to correct bias and better estimate the variability of the population
How do you calculate standard deviation step by step
To calculate standard deviation first find the mean of the dataset Then subtract the mean from each data point Next square each deviation and sum all squared deviations After that divide by N for population or n minus one for a sample Finally take the square root of the result to get the standard deviation
Why is standard deviation important
Standard deviation is important because it measures how much variation or dispersion exists in a dataset It is widely used in finance to assess investment risk in education to analyze test score consistency in research to evaluate experiment reliability and in manufacturing to maintain quality control
Can standard deviation be zero
Standard deviation can be zero when all data points are identical This indicates that there is no variability or deviation in the dataset and every value is exactly equal to the mean
Conclusion
Standard deviation formula डेटा की विविधता को मापने का एक अनिवार्य उपकरण है। इसे समझकर और सही तरीके से लागू करके आप डेटा के आधार पर सटीक निर्णय ले सकते हैं। चाहे व्यवसाय हो, शोध हो या दैनिक जीवन, Standard deviation डेटा-चालित निर्णय लेने की क्षमता को बढ़ाता है।